What is Surface Roughness: Definition, Parameters, Symbols and Measurement
Written By:
Gavin Leo
Updated By: Gavin Leo
Published:
Updated
Share:
Table of Content
Table of Content
During my nearly six years of working at Aria Manufacturing, I discovered that many of our customers had some misunderstandings regarding surface treatment. Some customers did not make any requirements for surface treatment when designing the parts, while others had overly strict requirements for it.
Both mistakes cost money, One will cause assembly problems, while the other will lead to increased production costs and delivery delays.
So I put together this guide to walk you through everything you actually need to know about surface finish: what it means, how it’s measured, how to read drawing symbols, and which finishing process is right for your part.
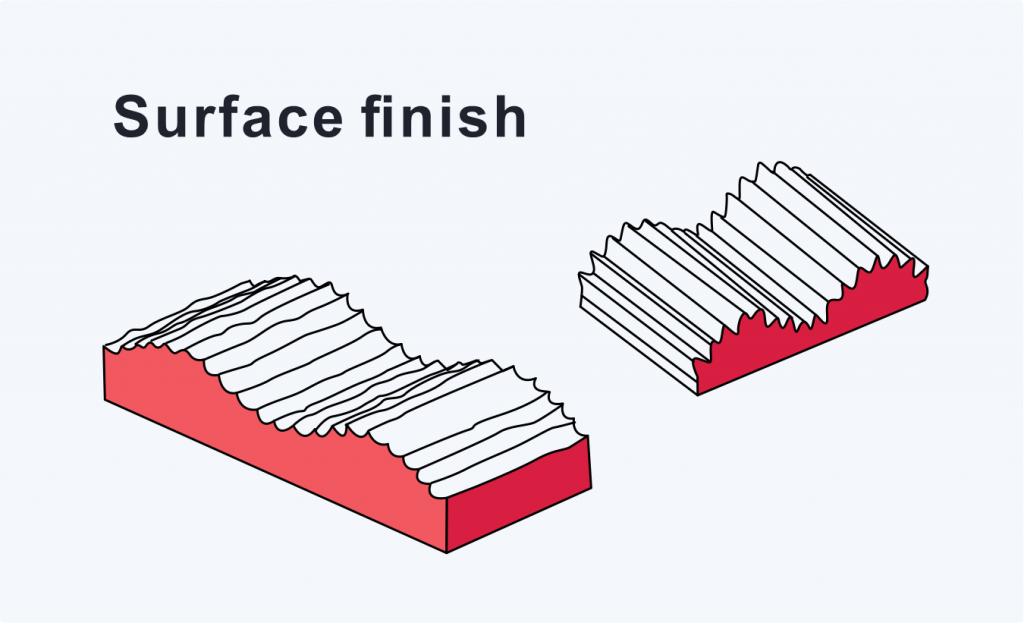
What is Surface Finish?
Surface finish is the overall description of a surface including texture, imperfections, material add-ons, and coatings.
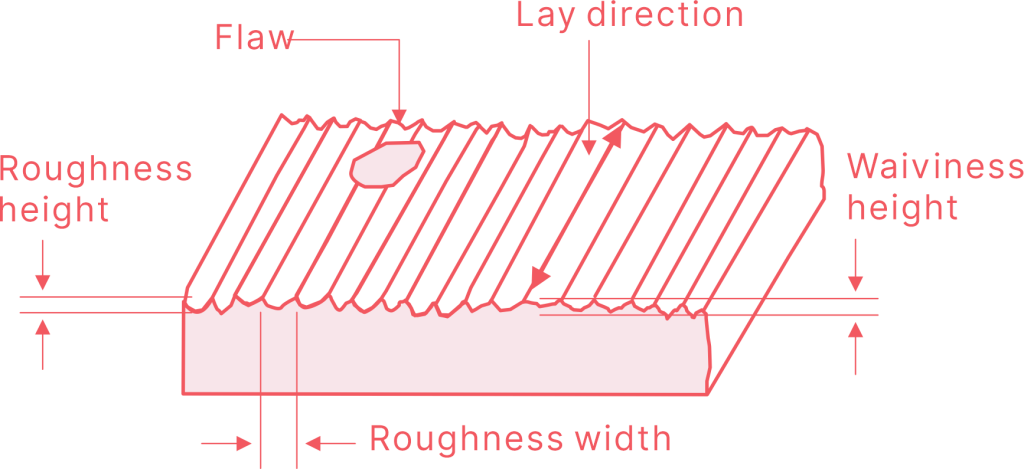
Surface texture isn’t one thing. It’s three things layered on top of each other.
1.Roughness
Roughness is the fine-scale component. Think of it as the texture left behind by the cutting tool: small, closely spaced peaks and valleys that are typically invisible to the naked eye but measurable with a profilometer.
This is what engineers most often specify on drawings. It’s quantified with parameters like Ra, Rz, and RMS.
2.Waviness
Waviness sits one level above roughness in the spatial frequency hierarchy. It’s the broader, more gradual undulation of the surface, caused by things like spindle runout, machine chatter, thermal distortion during machining, or workpiece deflection under cutting forces.
Waviness matters for bearing races, sealing surfaces, and any application where a surface would cause problems.
The main waviness parameters are:
Parameter
What It Describes
Wa
Average waviness height
Wt
Total waviness height
Wsm
Average waviness spacing (peak-to-peak)
3.Lay
Lay is the direction of the dominant surface pattern. On a turned shaft, the lay runs circumferentially. On a milled flat, it runs along the feed direction. After grinding, you often see a multidirectional or random lay.
Lay affects friction, fluid flow, and how two mating surfaces interact under load.
Why is Surface Finish Important in Manufacturing?
Surface finish affects whether your part works. Not just how it looks. Here’s what I’ve seen go wrong when surface finish is ignored or mis-specified:
Premature wear
Rough mating surfaces wear out faster. The asperities (those microscopic peaks) rub against each other, generate heat, and accelerate material loss. On a shaft in a bearing housing, this failure mode shows up fast.
Sealing failures
A gasket surface that’s too rough leaks. A surface that’s too smooth can also cause problems because the seal has nothing to “bite” into. There’s an optimal range for every sealing application.
Fatigue cracking
Surface irregularities act as stress risers. Under cyclic loading, cracks initiate at the base of valleys. This is especially critical for aerospace and medical components.
Coating delamination
Paints and platings need a specific surface profile to adhere properly. Too smooth and the coating peels. Too rough and the coating thickness becomes uneven.
Assembly headaches
If mating surfaces are rougher than specified, press fits can seize up or interference fits won’t assemble within tolerance. On the flip side, over-specifying surface finish has its own cost: longer machining time, secondary grinding operations, higher scrap rates.
At Aria, we use the same principle every time a job comes through: specify the roughest surface that still meets the functional requirement. Nothing smoother than necessary. That keeps costs down without compromising quality.
Surface Roughness Parameters
The types of roughness parameters are far more numerous than what people are aware of, and each parameter reflects different information about the surface.
The most common ones are five: Ra, Rz, Rp, Rv, and Rmax.
Ra: Arithmetic Average Roughness
Ra is the arithmetic mean of the absolute deviations of the surface profile from the mean line, measured over the evaluation length. It’s the one you’ll see on almost every engineering drawing in the world.
Imagine drawing a centerline through your surface profile. Ra is the average distance between that line and all the peaks and valleys combined.
It’s expressed in micrometers (µm) internationally, or micro-inches (µin) in the United States.
RA Surface Finish Grade Numbers:
Ra (µm)
What it feels like
Typical process
12.5
Visibly rough
Sand casting, rough forging
3.2
Standard machined
General CNC turning/milling
1.6
Smooth machined
Precision CNC with sharp tooling
0.8
Fine ground
Cylindrical or surface grinding
0.4
Very smooth
Fine grinding, honing
0.1
Near-polished
Precision lapping
0.025
Mirror
Superfinishing, optical polishing
Rz: Mean Roughness Depth
Rz is the average of the five largest peak-to-valley height differences across the evaluation length.
The evaluation length is divided into five equal sampling zones. In each zone, the vertical distance from the highest peak to the deepest valley is measured. Rz is the mean of those five values.
Why does this matter? Because Rz is more sensitive to isolated surface defects like deep scratches, sharp burrs, or tool marks. A surface with one bad spike might have an acceptable Ra but a failing Rz.
Rp: Maximum Peak Height
Rp is the height of the tallest single peak above the mean line within the evaluation length. This matters when a single high asperity could cause interference, contact stress concentration, or damage in a mating assembly.
Rv: Maximum Valley Depth
Rv is the depth of the deepest single valley below the mean line within the evaluation length.
Deep valleys can trap contaminants, hold lubricant (which is sometimes desirable), or initiate corrosion. In food-grade and pharmaceutical equipment, Rv is a critical hygiene parameter.
Rmax: Maximum Roughness Height
Rmax (sometimes written as Rz1max) is the height difference in the single worst sampling length across the entire evaluation length. It’s the most sensitive of all the amplitude parameters to isolated defects.
I use Rmax routinely in quality control at Aria when we’re inspecting sealing surfaces and precision fits where a single bad spot can cause a rejection. If Ra looks fine but something still seems off, Rmax usually tells the story.
Surface Roughness Calculation Standard
There are two measurement standards for surface roughness: RA and RMS. The difference between them lies solely in the way of calculation.
RA
Ra surface finish takes the absolute value of each height deviation from the mean line, then averages them all. Every deviation gets equal weight, whether it’s a tiny ripple or a deep scratch.
Ra is the default for general machined components. It’s specified on the vast majority of engineering drawings globally and works well for surfaces where overall texture is what matters.
RMS
RMS squares each deviation before averaging, then takes the square root. That squaring step amplifies larger deviations disproportionately. A single deep valley or sharp spike will push RMS noticeably higher than Ra on the same surface.
RMS is preferred for optical surfaces, precision electronics, and applications governed by US optical standards (ISO 10110-8). If your application is sensitive to individual surface anomalies rather than average texture, RMS gives you a more honest picture.
How to Measure Surface Roughness
There are four main ways to measure surface roughness: direct measurement, non-contact, comparison, and in-process methods, each suited to different levels of precision and production requirements.
Direct Measurement (Stylus Profilometry)
The industry standard. A diamond-tipped stylus drags across the surface and traces every peak and valley. The instrument calculates Ra, Rz, RMS, and other parameters automatically. Accurate, traceable, and accepted by all major standards.
Non-Contact Methods
For surfaces where physical contact isn’t acceptable. White Light Interferometry (WLI) and Confocal Microscopy use light to map surface height without touching the part, producing full 3D surface data. The go-to choice for optical components, precision molds, and delicate surfaces.
Comparison Methods
Physical reference plates with known Ra values. The inspector compares the part surface by eye and touch. Fast and cheap, but subjective. Good for quick shop floor checks, not formal quality records.
In-Process Measurement
Sensors embedded directly into the machining process monitor surface finish in real time. Allows immediate correction before out-of-tolerance parts are produced. At Aria, we use in-process monitoring on high-volume runs to catch drift early and reduce scrap.
Surface Finish Symbols Callout
Basic surface texture symbol
Any manufacturing method is permitted unless the circle or bar is specified.
Material removal by machining is required symbol
This symbol means that material must be removed by machining to achieve the required surface finish.
Material removal prohibited symbol
The surface must be produced by processes such as casting, forging, hot finishing, cold finishing. Die casting,powder metallurgy or injection molding without subsequent removal of material.
Surface texture symbol
This applies to surfaces produced by any method, unless a bar, circle, or specific process is indicated.
Parallel to plane of projection symbol
A blade-shaped tool is required to create creases that are parallel to the surface indicated by the symbol in the diagram.
Practical examples
Common Surface Finishing Techniques
Now let’s talk about the finishing processes themselves. Depending on the desired level of smoothness or functional requirements, you can choose different surface treatment processes:
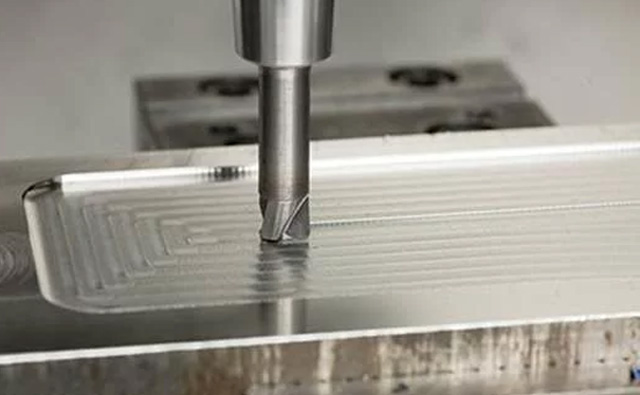
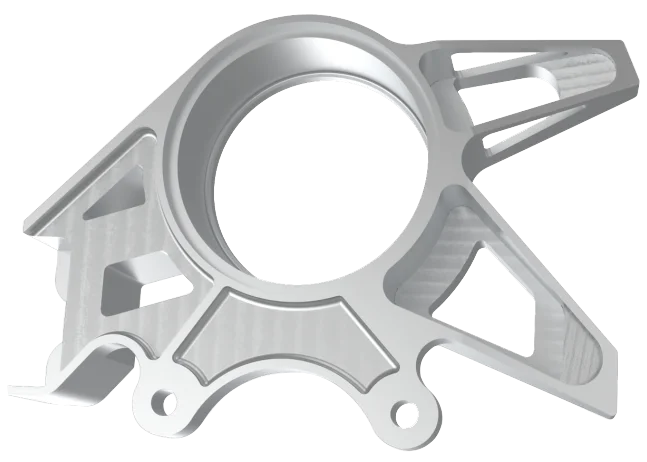
Machining
CNC turning, milling, drilling, boring, reaming. This is where most parts start, and for many applications, it’s also where the surface finish story ends.
Grinding
Grinding uses a rotating abrasive wheel to remove material and achieve tight dimensional tolerances combined with smooth surface finishes. It’s the go-to process when a cutting tool alone can’t get the surface smooth enough or the tolerance tight enough.
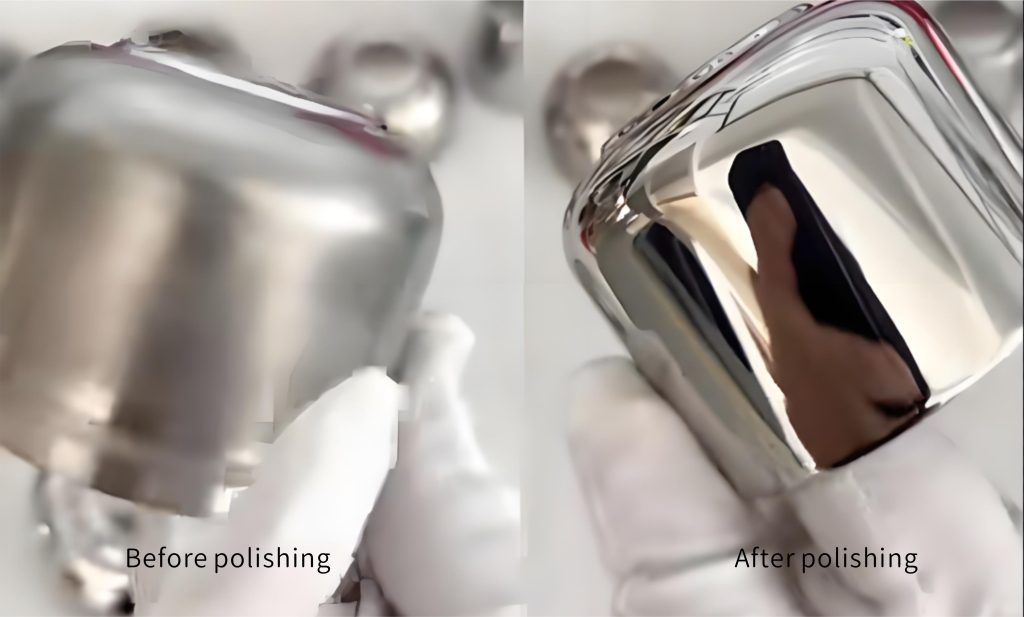
Polishing
Polishing is the process of progressively refining a surface through decreasing grit sizes until the desired smoothness is achieved.
Honing
Honing uses bonded abrasive stones that both rotate and reciprocate axially inside a cylindrical bore, creating the characteristic crosshatch pattern you see inside engine cylinders.
Lapping
Lapping uses a flat plate and a loose abrasive slurry (fine abrasive particles suspended in a carrier fluid) to simultaneously achieve extreme flatness and smoothness. Both the part and the lapping plate move relative to each other.
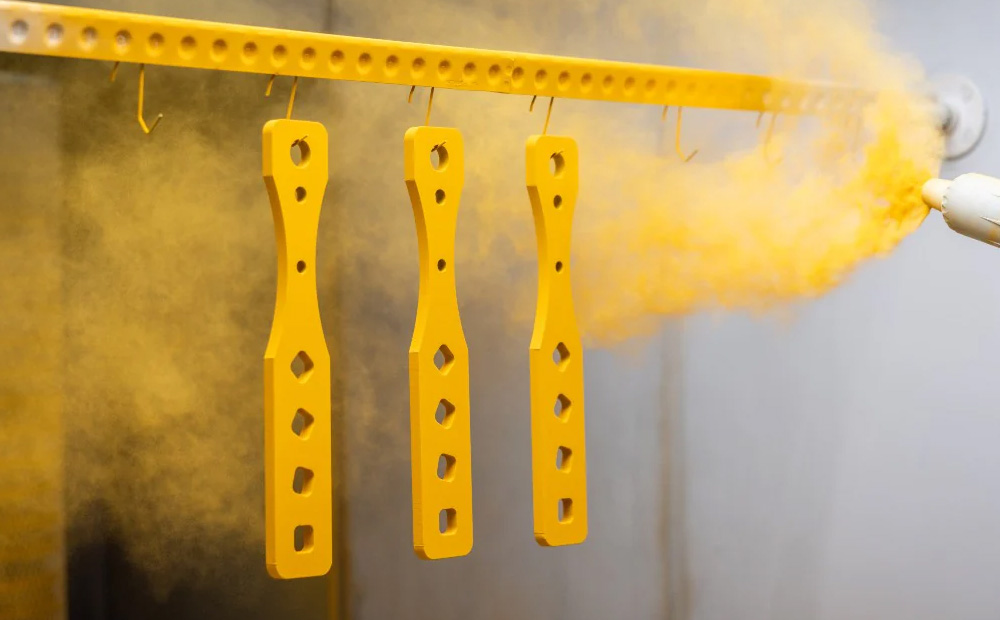
Coating
Coatings add a layer of material to the surface. That material change alters appearance, corrosion resistance, hardness, and other functional properties.
Common coating treatment methods include electroplating, power coating, and sandblasting.
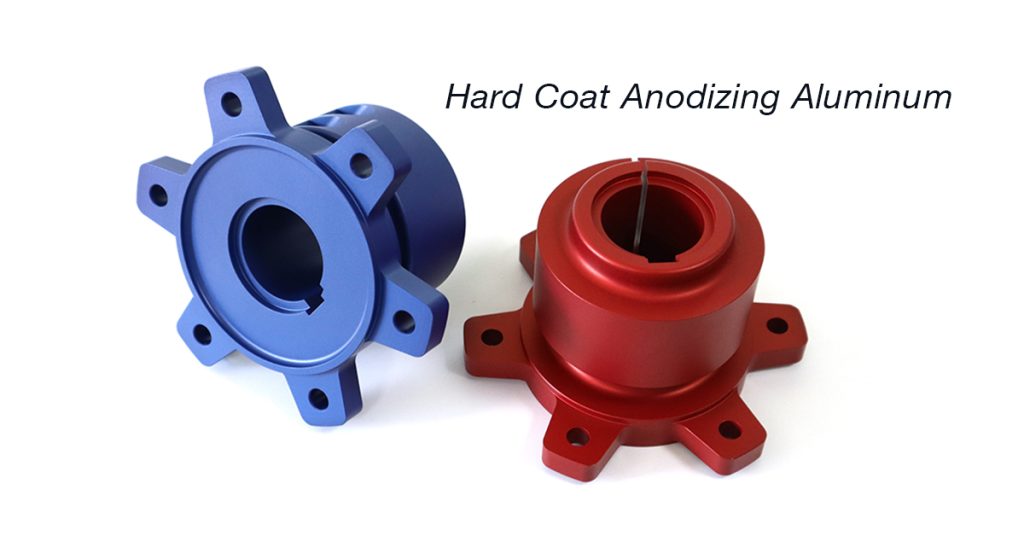
Anodizing
Anodizing is an electrochemical oxidation process that grows a controlled aluminum oxide layer on the surface of aluminum parts. The part goes into an acid bath (usually sulfuric acid), and an electrical current drives the oxidation.
Surface Roughness Chart
Surface Roughness Conversion Chart
Use this table when you need to convert between Ra, RMS, and Rt values, or between µm and µin. The following table is given in ISO 1302:1992.
Roughness N ISO Grade Numbers
Roughness values Ra micrometres (μm)
Roughness values Ra microinches (μin.)
RMS
CLA (μin.) Center Line Avg.
Rt Roughness, microns
N12
50
2000
2200
2000
200
N11
25
1000
1100
1000
100
N10
12.5
500
550
500
50
N9
6.3
250
275
250
25
N8
3.2
125
137.5
125
13
N7
1.6
63
64.3
63
8.0
N6
0.8
32
32.5
32
4.0
N5
0.4
16
17.6
16
2.0
N4
0.2
8
8.8
8
1.2
N3
0.1
4
4.4
4
0.8
N2
0.05
2
2.2
2
0.5
N1
0.025
1
1.1
1
0.3
Surface Roughness Comparison Chart
Here’s a quick reference table I use as a starting point when discussing finish requirements with customers:
Gavin Leo is a content editor at Aria Manufacturing with hands-on experience in CNC machining, Injection molding, materials selection, and part design. Outside of work, he enjoys hiking and collecting mechanical watches.
Gavin is a manufacturing specialist and content editor at Aria Manufacturing. With years of experience in CNC machining and mechanical design, he helps global clients choose the right manufacturing solutions and improve part performance while reducing costs.
Custom Quality Parts By Aria
Send your specs. We’ll get back with a quote in 12 hours.