What is Surface Roughness: Symbols Chart & Measurement Method

Surface Finishing

Surface roughness plays a critical role in mechanical engineering, machining, and many other disciplines, but it might be hard to understand for those without experience in those fields. Although it may seem trivial for those who aren’t machinists or work outside of the manufacturing industry, it can be essential to ensuring that a manufactured item is able to provide both the correct performance and appearance. In some cases, it can be the difference between life and death.

Surface roughness can be measured on numerous material surfaces, including metals, plastics, ceramics, and composite materials. Surface roughness measurements are essential metrics used to quantify the texture and topography of a manufactured surface. It is therefore an essential concept in a large number of industries.

This article is designed to help engineers and others understand what surface finish or roughness is and why it’s important. Let’s look at a few of the most common ways to calculate and describe the roughness of a given surface, why it matters, and we’ll finish up with some handy charts to help you convert between the various units of measure and better understand their use.

What is Surface Roughness in Manufacturing?

Surface roughness, also called “surface finish”, refers to the measure of a surface’s texture. It’s generally caused by imperfections in the manufacturing process and can affect a product’s appearance, functionality, aesthetic appeal, or performance.

CNC Machined Part

Surface Roughness Symbols Chart and Abbreviations

There are many symbols used in surface finish that may seem difficult to understand at first, but the chart below will help explain what each symbol means and how it’s used. Before we reach the chart, however, it’s important to explain a little bit about each symbol, how it’s used, and what it means.

There are many surface finish symbols and measurements involved in determining the roughness of a surface’s finish, and it can be difficult to remember which is which or when to use one instead of the other. A bit further down, we’ll have a surface finish chart and a cheat sheet that you can bookmark as a quick reference guide.

Generally speaking, roughness measurements are taken from a specific representative sample of the object’s surface, unless it’s something like a medical implant or another device that needs absolutely smooth surfaces on all sides.

Surface roughness measurement techniques vary by industry and purpose. Some use contact methods like stylus profilometers to advanced 3D optical scanners. Atomic Force Microscopy (AFM), for example, provides atomic-level resolution for nanoscale surface characterization. Other methods include Optical Profilometry, which uses light interference to map surface topography without touching the sample, suitable for fast, non-destructive testing.

Surface roughness parameters like Ra and Rz are used to quantify surface irregularities. Each unit of measure describes something about the roughness of a surface, but each one has a different purpose. Ra surface finish is the most commonly used and the one with the greatest number of use cases, but it’s not perfect for every situation.

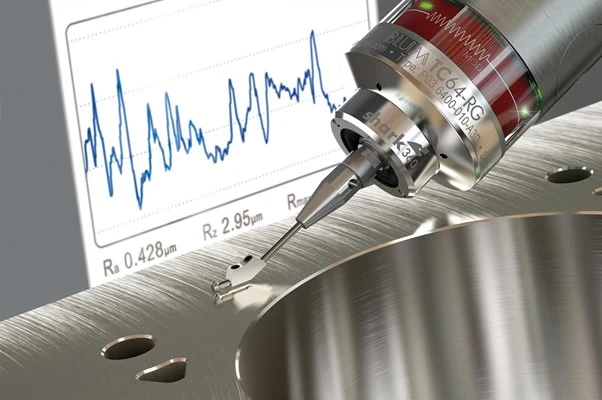
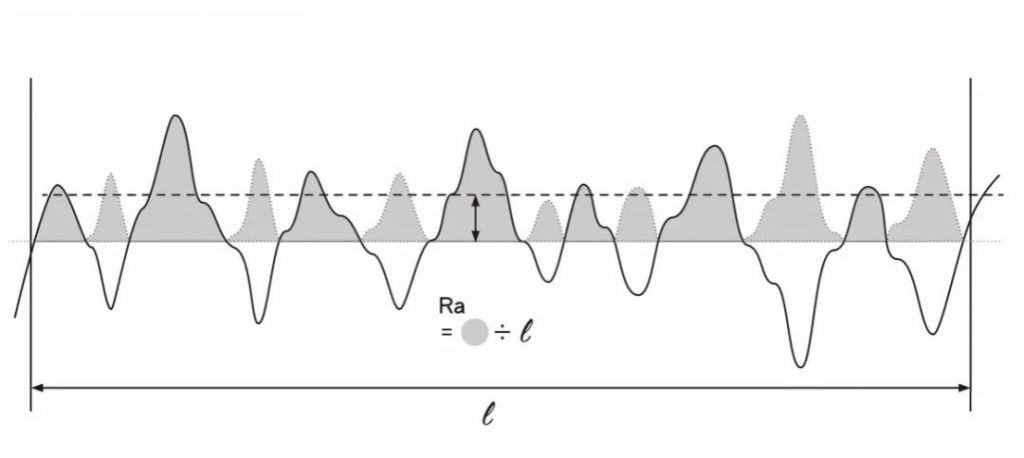
It’s calculated by analyzing a section of the item’s surface called the sampling length, and determining the number of standard deviations from a completely flat surface, typically measured in either micrometers or microinches.

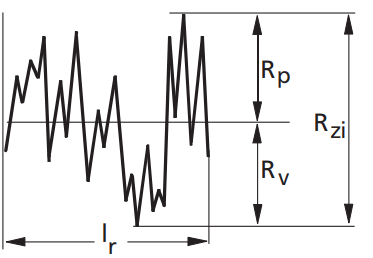
Rv shows the depth of the lowest valley, which can be essential for preventing deterioration. Imagine a miniature dental implant, which usually ranges between 1.8 and 3.3 millimeters and lasts from 6 to 10 years.

However, if a valley in the middle of the implant is too deep, the wear resistance won’t be sufficient and it can potentially degrade too quickly, potentially even breaking in half inside a patient’s jaw after a few years of chewing. A company specializing in these implants would soon go out of business if it used Ra or other factors instead of Rv.

Similarly, Rp shows the height of the highest peak. In sticking with the medical analogy, imagine a patient with an artificial hip or knee, which contains ball-and-socket joints. If either one (or both!) has peaks that are too high, they can scrape against each other, leading to both the unit degrading and significant pain for the user.

Conversely, optimized surface roughness Ra levels can improve the strength of material joints by providing better interlocking at the microscopic level.

As the roughness of a surface can influence the adhesion of coatings, which is important in industries such as automotive and aerospace, the Rv and Rp values are essential in these and other industries.

Another important measure is Rt, the distance of the total profile between the highest peak and the lowest valley. This is essential for surface integrity, detecting outlier damage, and monitoring the overall surface quality. It captures both Rv and Rp, although as a single unit and not separately, allowing you to see the total variance at a glance.

Rmax is essential for a variety of applications, but perhaps most of all, the medical industry. It shows the vertical height disparity between the highest and lowest points, similar to Rt. It’s vital when used to evaluate medical instruments, particularly surgical tools like scalpels, where a variance of even 0.5 micrometers can prevent the tool from becoming fully sterilized. Tools whose Rmax value is too high can lead to a significant increase in patient infections and deaths if not corrected.

For applications where Ra needs just a little more specificity, RMS (or Root Mean Square) can be used. It’s calculated by taking the square roots of the different heights within the sample and averaging them together, which gives a fuller picture than Ra alone.

This is most important for ensuring proper seals, predicting the results of friction, and analyzing fatigue resistance, which ensures a longer lifespan and the proper function of the item.

The N-grades, typically N1-N12, are used to easily facilitate the transfer of information by reducing ambiguity. Ra values are assigned to N-grades (N3 being 0.1 micrometers or 4 microinches, for example), which streamlines communication between fields.

This is why they’re commonly used in technical drawings, schematics, blueprints, and design specifications, as the values are understood by engineers, inspectors, and machinists alike.

If you’re working in the plastic industry, your primary unit of measure will be SPI, named for the Society of the Plastics Industry, the organization that introduced and standardized the system. Most of their standards are based on Ra and Rmax, although others are also used depending on the specific application.

Both micrometers and microinches are used in SPI, depending on the country of origin. This means you may need to convert between the two and always double-check your units when interacting with information or specifications from other countries.

Although there are other units of measure and ways to describe the roughness of a given surface, these are the most common and the ones that are most applicable to the highest number of industries. If you’re involved in those specific industries, those niche measurements will be explained to you when you’re hired, but it’s important to understand the basics first.

However, it’s also useful to understand the core concept behind surface finish and the most popular ways to measure it as a background.

Here is a convenient chart of surface finish symbols and their meanings to help you remember which one is which.

Document
Symbol Meaning Measurement Method Applications
Ra Roughness Average Microinches or Micrometers Most commonly used formula
Rv Maximum Profile Valley Depth Depth of deepest valley Finish application/adhesion
Rp Maximum Peak Height Height of highest point Adhesion
Rt Total height of profile Distance between lowest and highest points Overall quality of surface
RMax Maximum height of profile Vertical distance between highest and lowest points Severity of height disparity
RMS Root Mean Square Functions similarly to Ra Ra, but with more emphasis on deviations
N1-11 N-grades ISO standard Used on technical drawings
SPI Society of the Plastics Industry Standardized Measure Used specifically in the plastics industry

How to Measure Surface Roughness

There are several different methods and units of measure used when determining how “rough” a surface of an object or product is, but many of the most common measurements are calculated based on the lowest peak, the highest valley, and their relationship to the median surface of the item in question.

Ra (Roughness average) is the most common unit of measurement and is expressed in micrometers or microinches. It is generally the default measurement system, although there are many situations where a more specific measure would be preferred. It is calculated by taking the arithmetic mean or average of the absolute value of the highest and lowest points of a sample section.

Although Ra is the most common symbol, there are also multiple other symbols and formulas commonly used in different cases. Each one has its own particular set of benefits and drawbacks, as well as situations where it’s the preferred method for calculating the roughness of a particular surface.

For example, let’s imagine that you’re manufacturing a smaller, thinner product that doesn’t require a completely level surface. A slight variance is acceptable, as long as the lowest valley isn’t too deep, because that would jeopardize the structural integrity of the item too quickly. Instead of lasting years, it might fall apart after a few dozen uses (or sooner). By contrast, smoother surfaces reduce friction and wear between moving parts, increasing efficiency and lifespan.

In this situation, Ra would not be the preferred measure to determine the smoothness of the item. It’s generally rather useful, but it doesn’t provide the critical information needed to ensure the product has a reasonable lifespan. For situations like these, you’ll want to use Rv (Maximum Valley Profile Depth), which does tell you what you need to know.

If the issue is in the opposite direction (i.e., having too high a peak would reduce the usefulness or lifespan of the item being machined), you’ll want to use Rp (Maximum Profile Peak Height).

Arithmetic mean surface roughness (Ra)

Rp is particularly useful in automobile manufacturing and other fields where an item with too high a peak could represent a safety hazard or cause two adjacent items to touch when they shouldn’t.

No matter how well the product works or what it is, no one is going to want to buy it if they have to hear the constant sound of metal scraping against metal during operation.

Rz (Roughness depth) is another common measure that uses a similar process, but focuses only on the highest and lowest points. It’s a more specific number, as it focuses only on the extremes. It’s often used to provide additional detail, as two entirely different sections could have the same Ra value, whereas Rz will help narrow down the specific cause and nature of the surface’s roughness.

The Rz value measures the difference between the highest peak and the lowest valley within the sampling length of five lines. In some locations outside of the United States, Rz is the most common way to describe the depth of a surface, as opposed to the American standard Ra.

Another value that helps clarify the highest peaks and deepest valleys is RMS, the surface’s Root Mean Square. RMS uses the square root of the average values of the highest and lowest points squared. This is another way to more accurately represent height disparities, similar to Rz and in contrast to Ra.

You may have noticed that most of these measurements fall into one of three categories. Surface roughness parameters can be separated into three basic types: Amplitude Parameters, Spacing Parameters, and Hybrid Parameters.

Amplitude parameters measure the height and depth of peaks or valleys, while spacing parameters are used to note the difference between the highest or lowest points compared to the mean line on the unit’s surface. Hybrid parameters, as their name implies, combine both characteristics into a single metric.

Surface Roughness Conversion Table

As we mentioned earlier about the N-grades, communication between industries and even professionals within the same industry can be difficult due to the high number of symbols and calculation methods involved.

Here is a conversion table that will help you move between various units of measure if you’re working cross-industry or internationally. It may seem like we’re hammering this point home, but it’s so important that it bears repeating: if you’re working across international borders to or from the United States, it’s essential that you confirm that you’re both using the same units of measure, in metric or imperial.

Depending on the scope of the project or job, a miscommunication or error arising from one side using the wrong unit of measure or system could cost thousands or even millions of dollars. All of the understanding and knowledge of surface finish won’t help if the measurements are off by a significant amount due to one side using the “wrong” units of measure.

Notice that values like Rv and Rp are not included on this chart, because they are simply linear measurements in either micrometers or microinches and not units of measure themselves.

Document
Ra (Microinches) Ra (Micrometers) N-Grade RMS
1 0.025 1 1.1
2 0.05 2 2.2
4 0.1 3 4.4
8 0.2 4 8.8
16 0.4 5 17.6
32 0.8 6 32.5
63 1.6 7 64.3
125 3.2 8 137.5
250 6.3 9 275
500 12.5 10 550
1000 25.0 11 1100
2000 50.0 12 2200

Surface Roughness Chart Cheat Sheet

Now that we’ve discussed the various types of surface finish and ways to measure them, it’s important to add real-world context. Just knowing about Ra values doesn’t provide the actual context required to know what various levels of roughness would look like in the real world.

This roughness chart cheat sheet shows various Ra levels, what they look like, and the types of applications where that level would generally be acceptable. This is a general guide, of course, and shouldn’t be taken 100% at face value in every situation. The finish on a large construction tool and a miniature medical implant will obviously have different requirements and acceptable thresholds for smoothness.

Always remember that when you’re communicating with another person about surface finish, and you’re using specific units of measure or descriptors, it’s essential that you’re both using the same units. Billions of dollars across multiple industries are lost every year because someone uses Rmax instead of Rt or similar mistakes of that nature.

Document
Microinch Micrometer Description of Surface
1000 25 Extremely rough, similar to the cuts you'd see if you cut something with a saw
500 12.5 Also very rough, surface will look like it's been cut with a heavy knife
250 6.3 This is the level you'd typically see if the surface was finished by grinding
125 3.2 Normally the highest acceptable level for most parts, although some applications will have a lower threshold
63 1.6 At this level, surfaces will look like they were machined at relatively high speeds
32 0.8 This higher-grade machine finish is ideal for applications with heavy loads and non-moving parts
16 0.4 A difficult level to achieve, this is mostly only seen when there are specific legal or functional requirements associated with the item
21 0.05
0.025
This absolute level of precision generally requires honing, buffing, or superfinishing. Most gauge blocks are around this level

Surface Roughness Chart

As noted previously, SPI refers to the Society of the Plastics Industry, which uses a specific scale to measure surface roughness for its products. With plastics, smooth surfaces are essential for both commercial and technical products. No one wants to buy a Tupperware container with bumps large enough to be felt.

Plastics are also essential to the aerospace industry, which relies on thermoplastics, composite materials, and many other applications. Poor surface quality, if a surface deviates too much or has an insufficient roughness profile, could put lives at risk and potentially destroy billions of dollars in technology, not to mention years of research.

Document
SPI Standard Finish Type Typical Surface Finish
A1 Super Glossy Typical Surface Finish (Metric Ra)
A2 High Glossy 0.012 to 0.025
A3 Normal Glossy 0.025 to 0.05
B1 Fine Semi-Glossy 0.05 to 0.1
B2 Medium Semi-Glossy 0.05 to 0.1
B3 Normal Semi-Glossy 0.1 to 0.15
C1 Fine Matte 0.28 to 0.32
C2 Medium Matte 0.35 to 0.4
C3 Normal Matte 0.45 to 0.55
D1 Satin Textured 0.63 to 0.7
D2 Dull Textured 0.8 to 1.0
D3 Rough Textured 3.2 to 18.0

N1-N12 CNC Machining Surface Finish Chart

As a reminder, the N-grades use set Ra values to facilitate uniform communication between professionals and industries. By standardizing deviations from the mean, potential communication errors are significantly minimized.

They are ISO standards and are determined by the International Standards Organization. For reference, the ISO standard for surface roughness measurements is ISO 4287. When speaking with someone about surface finish in an international context, this is the preferred system to remove ambiguity.

Remember that Imperial units are in micro-inches (1/1000th of an inch), and metric measurements are in micrometers. If you’re working with a person or an organization where one of you is in the United States, and the other is in a different country, make sure you’re both using the same units to avoid massive headaches and wasted money.

Document
Roughness Grade Number Ra (Imperial) RMS (Imperial) Ra (Metric) RMS (Metric)
N1 1 1.1 0.025 0.035
N2 2 2.2 0.05 0.055
N3 4 4.4 0.1 0.11
N4 8 8.8 0.2 0.22
N5 16 17.6 0.4 0.44
N6 32 35.2 0.8 0.88
N7 63 69.3 1.6 1.76
N8 125 137.5 3.2 3.52
N9 250 275 8.3 9.13
N10 500 550 12.5 13.75
N11 250 275 8.3 9.13
N12 500 550 12.5 13.75
casibom casibom
Scroll to Top